
If the world were a village….
….a hands-on educational activity for 7-11 year olds
In spring 2015, I was approached by Global Renewables Lancashire Operations Limited about the design and manufacture of a hands-on activity as part of their education programme.
Global Renewables run waste recovery facilities (recycling) for Lancashire County Council and Blackpool Council. Their education team deliver a free environmental education programme to Key Stage 2 (7 to 11 year old pupils) at primary schools across Lancashire County and Blackpool designed to raise awareness and inspire behaviour change.
The brief described an activity, aimed at children aged 7-11, which would be used in the hands-on space at their education centre. The activity is based on the book: If the world were a village (Smith, D. J. and Armstrong, S, 2003).
The book is about the diversity of people who make up the population of the world. It also details the proportion of people who have and do not have access to different resources, for example food, water and sanitation. The whole population of the world is imagined as a village of just 100 people, each person representing about 67 million people from the real world. By learning about the ‘villagers’, who they are and how they live, we can find out more about our neighbours in the real world and the problems our planet may face in the future.
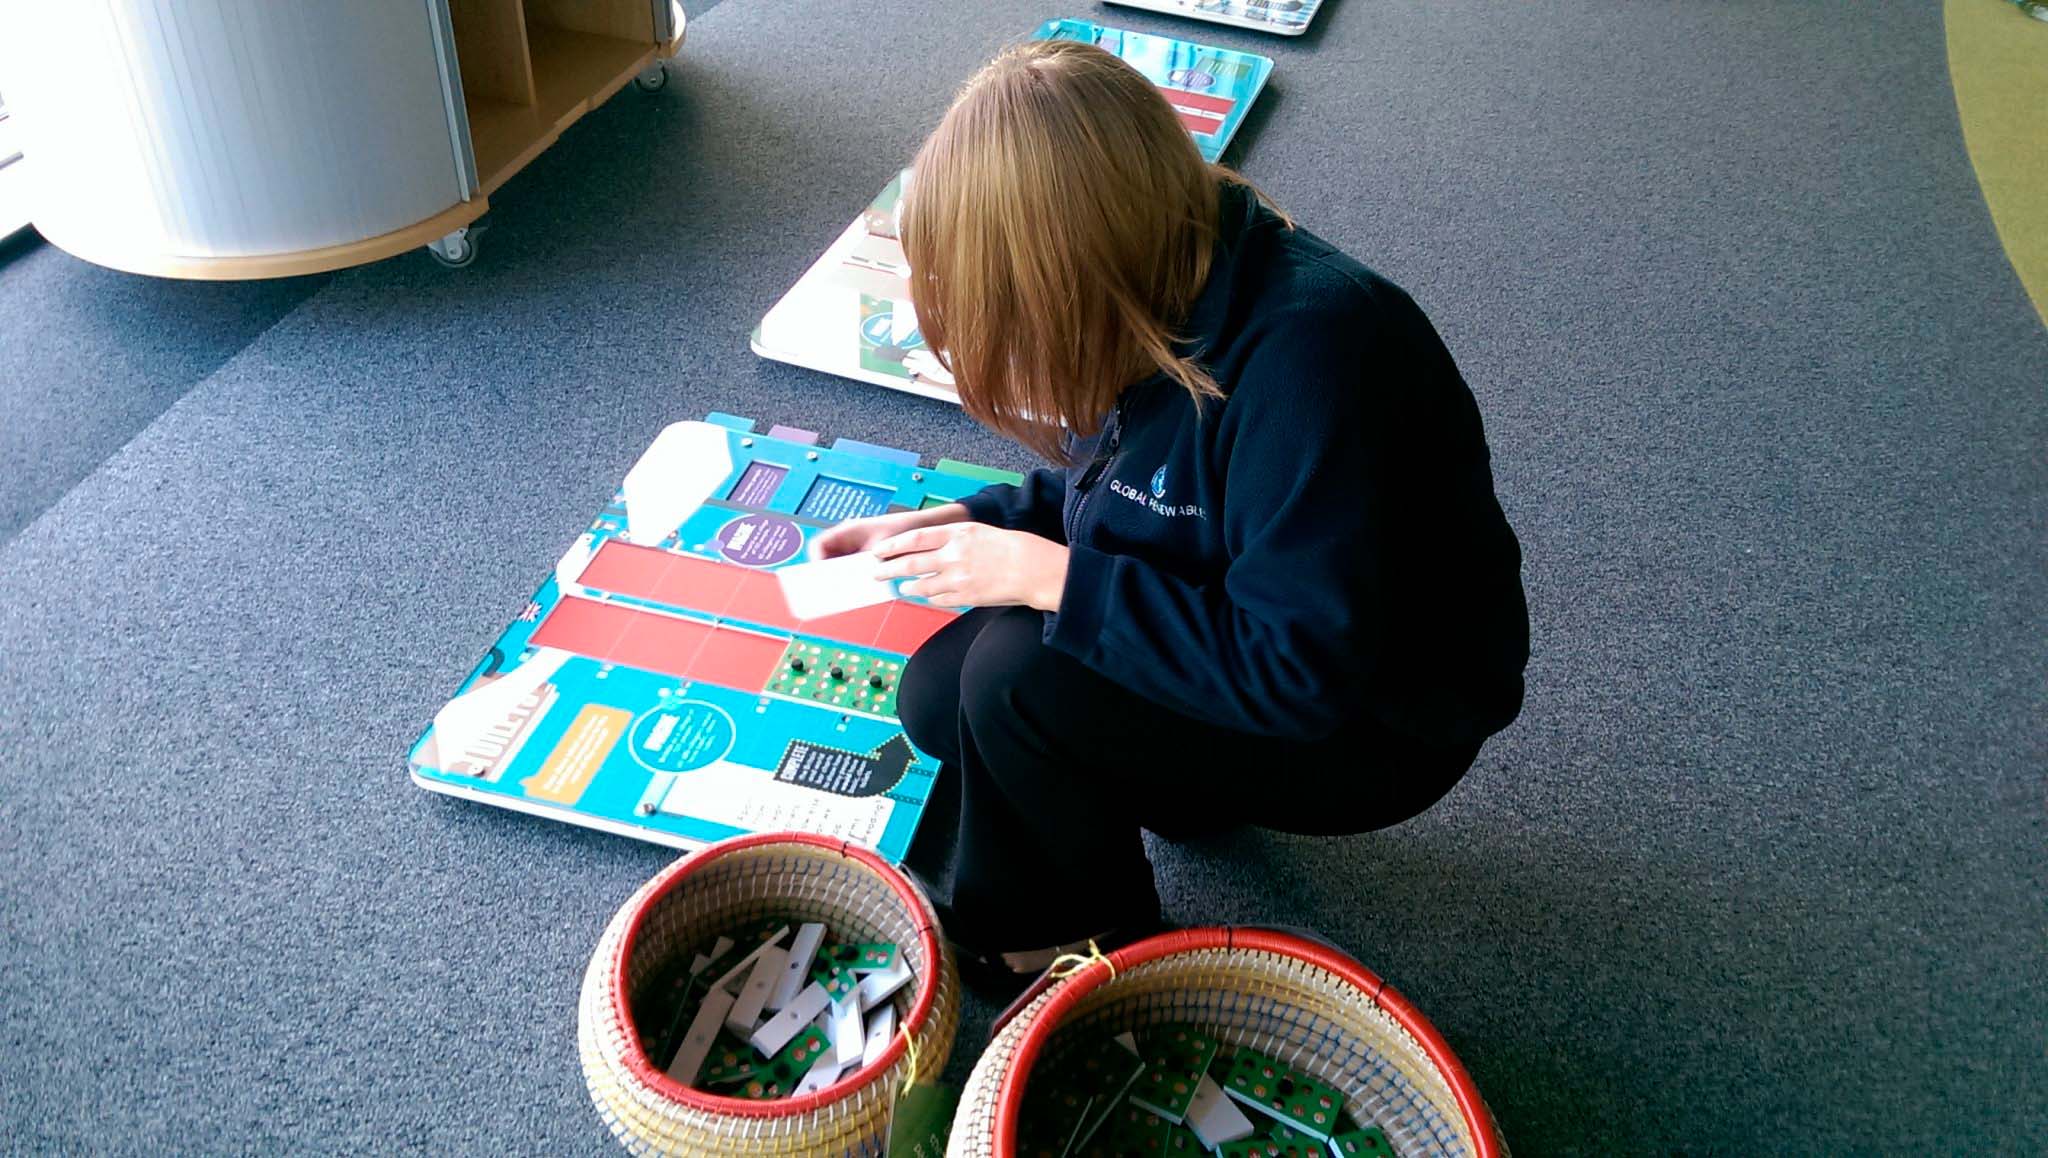
Finished activity in use
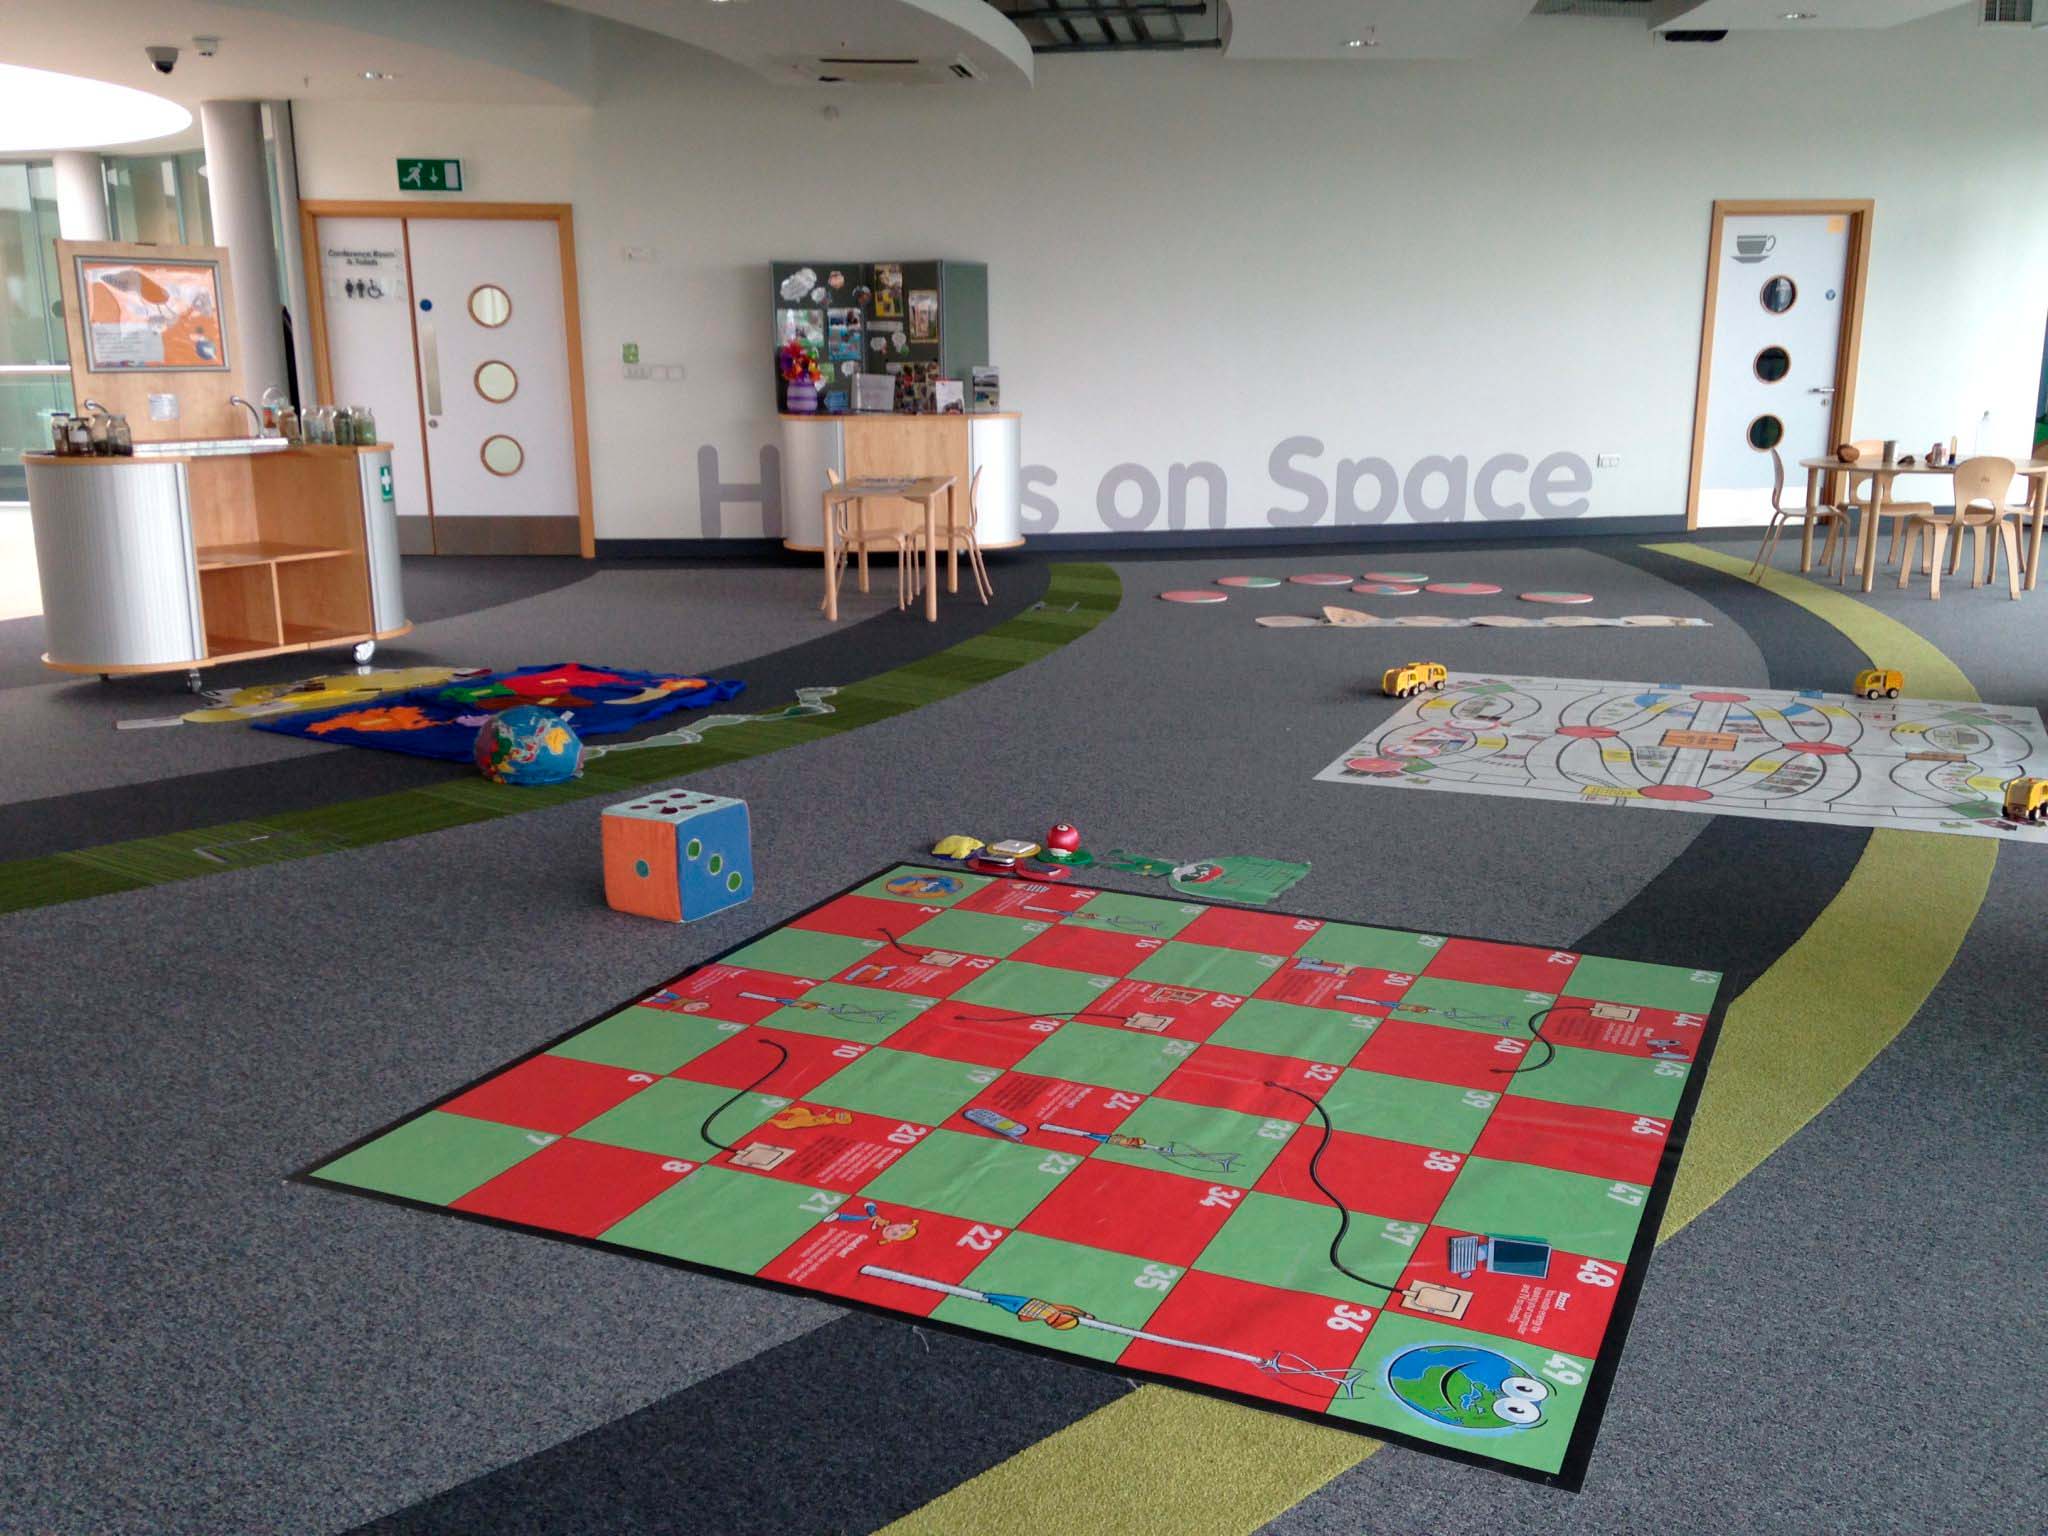
Hands-on space
Using further sources, the education team at Global Renewables also condensed the British population to a village of 100 people and found the proportions of those who have and do not have access to certain resources. This allows us to compare the distribution of resources between the population of Britain and the population of the whole world.
The activity they wanted would visually represent the concepts discussed above to help children recognise that resources are not distributed equally throughout the world or between people. They also wanted prompts for further discussion and to encourage the children to consider why this is. Resource use, distribution and management fits in with their education aims and programme which is not just about recycling rubbish.
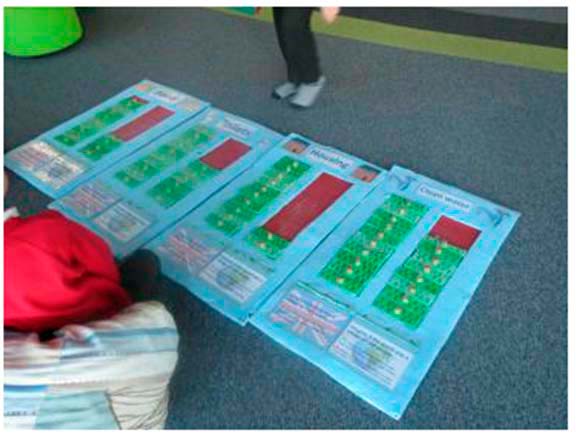
The education team had already created and trialed a prototype of the activity. Pupils used green blocks that represent 5 or 10 people to make bar charts to compare distribution of different resources between the world population and the British population.
This activity provided quite a challenge as the information they wanted to convey is quite complex for a hands-on activity. However, they had already completed a lot of prototype testing so had some clear ideas of what did and did not work. It was such a pleasure to work with a team who were so committed to the prototyping and evaluation process. I agreed to bid for the work and brought in interactives company FifeX who also brought a freelance illustrator to the team. We were delighted to be awarded the job and I went down to Leyland to meet the team and see how their education visits worked and get the feel of their other materials and the experience as a whole.
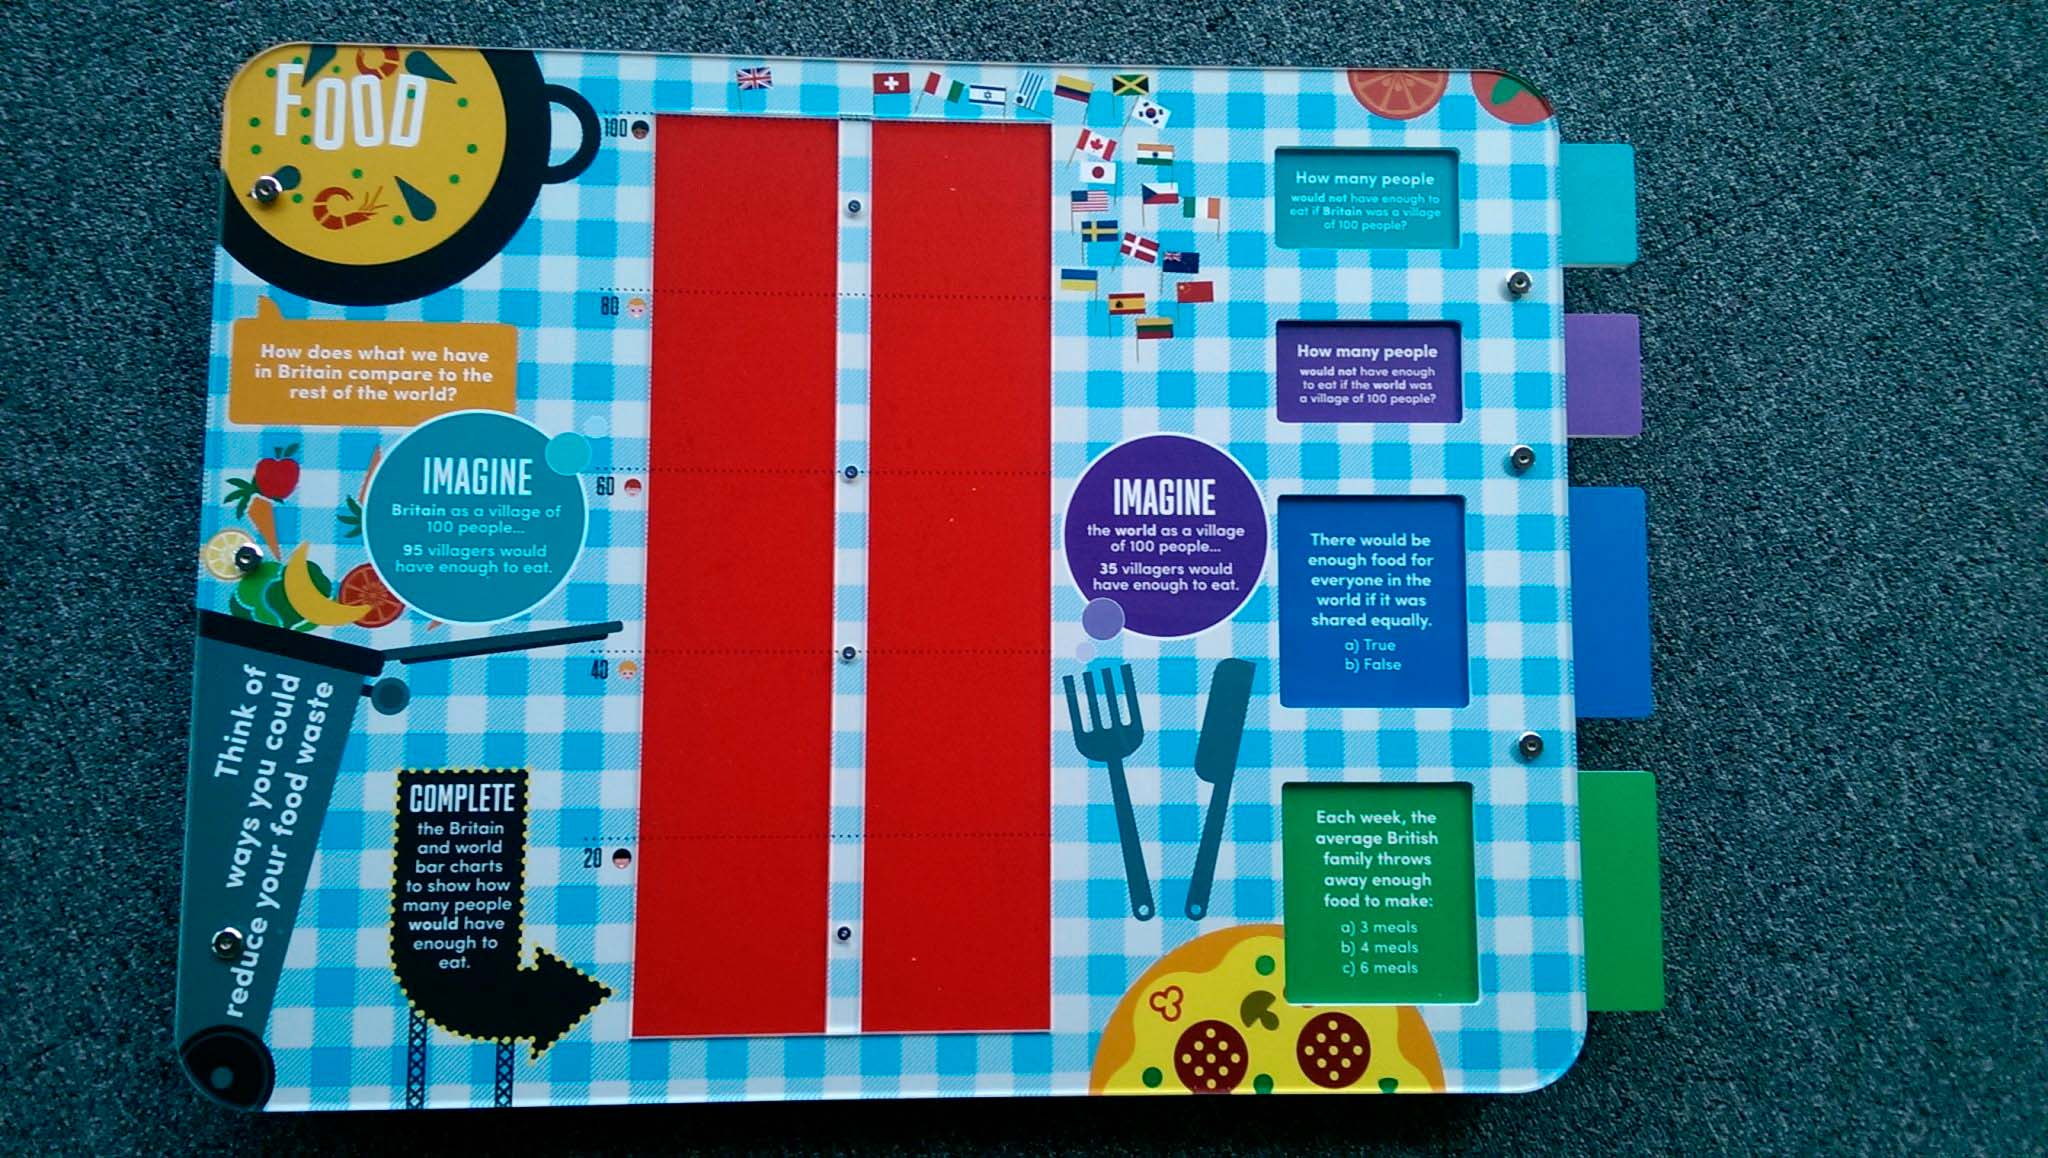
We continued to use the bar-chart activity, as it was really popular with teachers who had tested the prototype on school visits. We re-wrote the facts and discussion points to really focus on each issue and also to elicit the most discussion and we chose a slider reveal mechanism to give the answers to these questions.
I’m very pleased with the final activities and the Global Renewables education team are too. They are very appealing, intuitive and tactile to use and I hope will form a key part of school visits for many years to come helping to raise awareness and discussion about these really important issues.
If the world were a village of 100 people, how many have domestic electricity?
If the world was a village of 100 people, how many would have enough to eat? And in Britain?
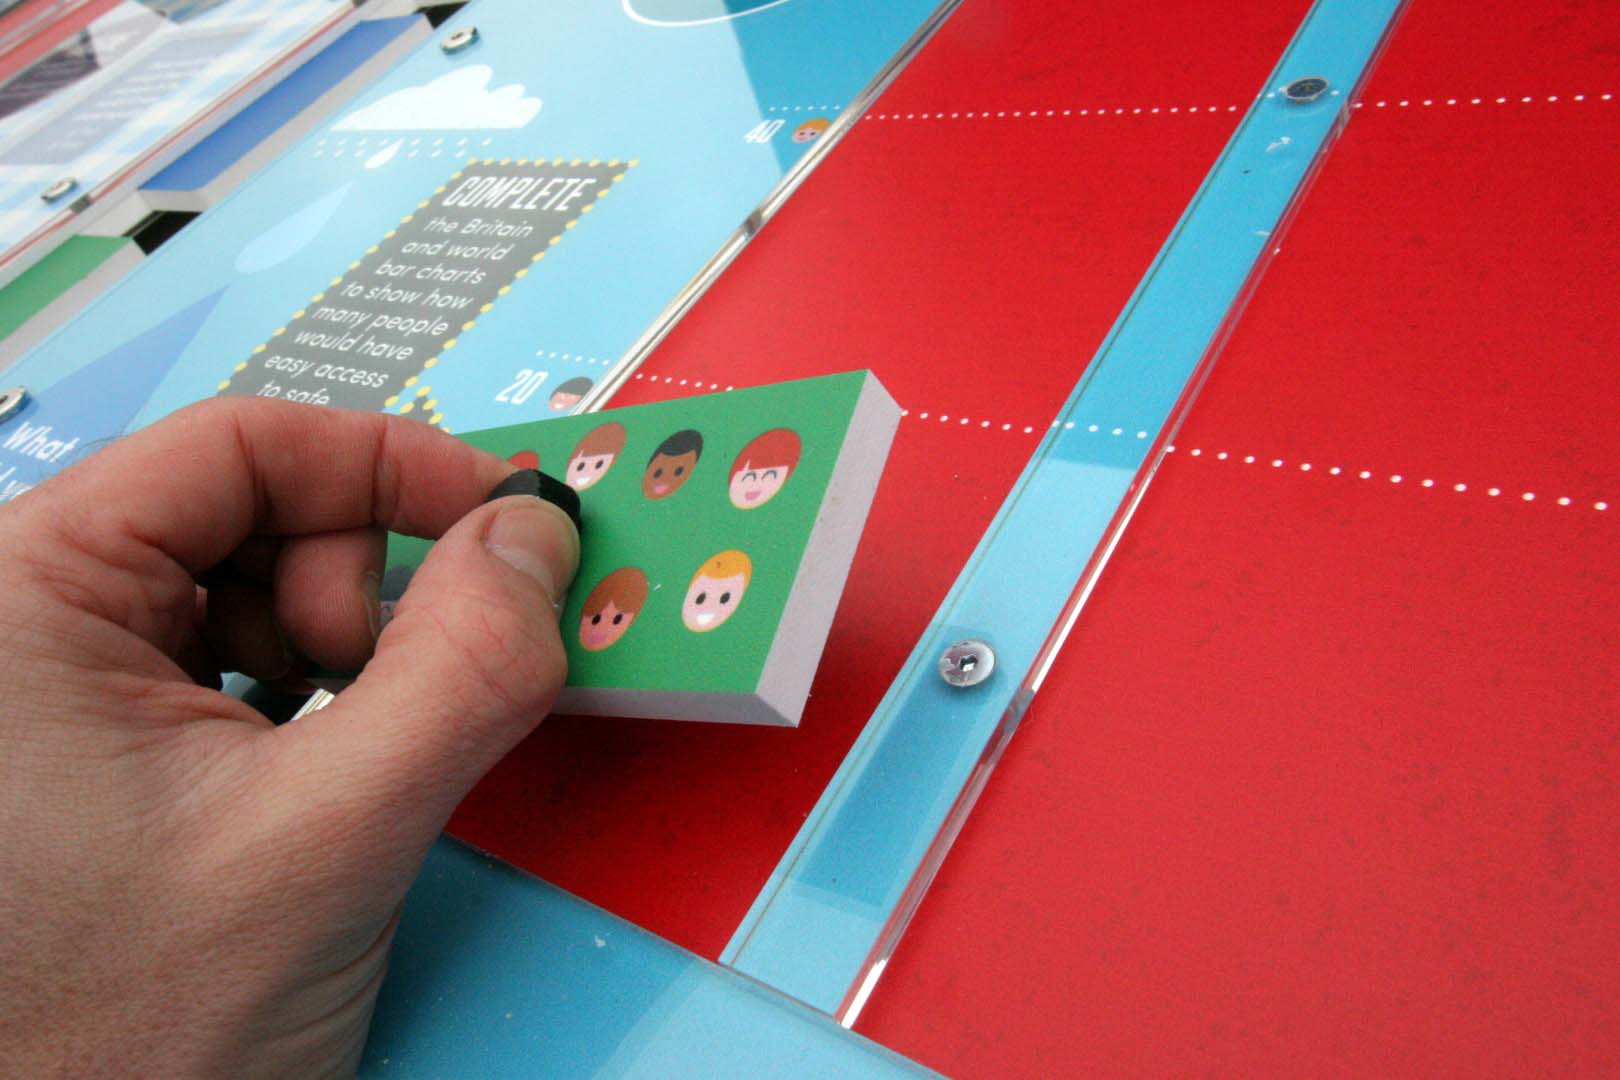
Make a bar chart
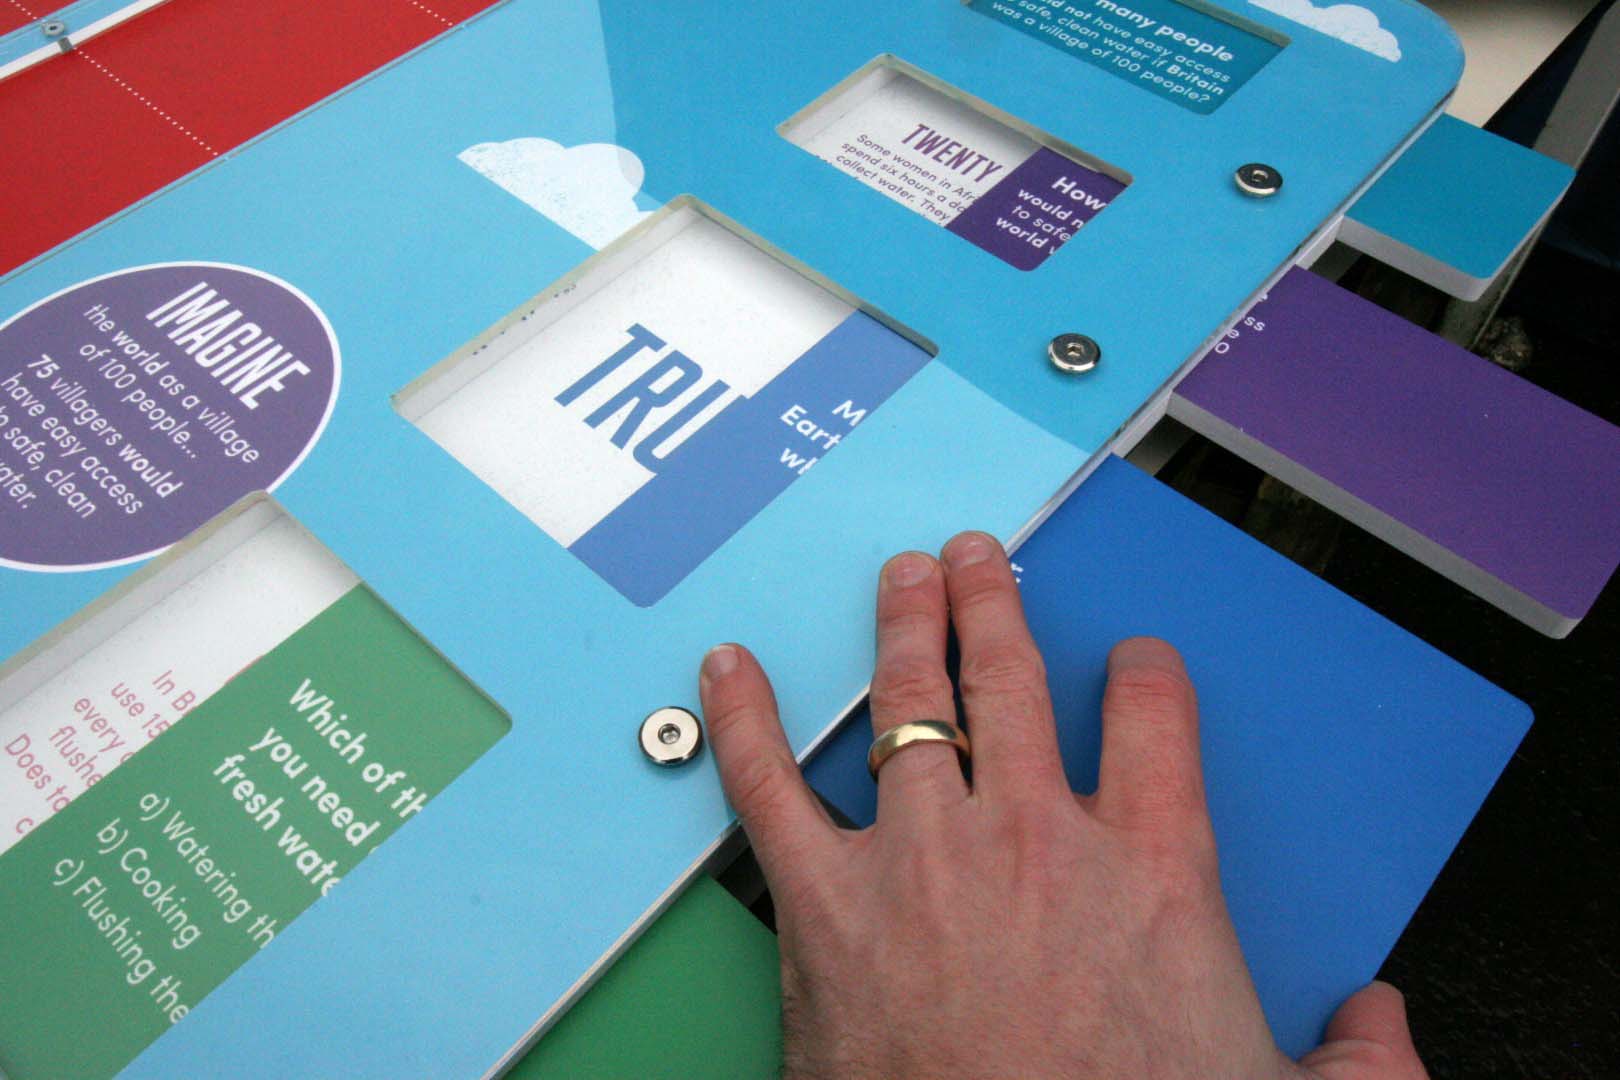
Slider mechanism